


For sound and informed policy-making, indicators at all levels must be taken into consideration. This blog presents two gender statistics’ indices whose disparate outcomes are caused by the investigation of different indicators. This blog also raises the issue of intersectional discrimination, which is currently not easily deduced from existing indicator sets. The policy-data integration tool: EPIC (Every Policy Is Connected), developed by ESCAP’s Gender Policy-Data Integration Initiative, may become the potential solution for increasingly reliable data to inform policy development and implementation.For sound and informed policy-making, indicators at all levels must be taken into consideration. This blog presents two gender statistics’ indices whose disparate outcomes are caused by the investigation of different indicators. This blog also raises the issue of intersectional discrimination, which is currently not easily deduced from existing indicator sets. The policy-data integration tool: EPIC (Every Policy Is Connected), developed by ESCAP’s Gender Policy-Data Integration Initiative, may become the potential solution for increasingly reliable data to inform policy development and implementation.
Current Deficiencies in Gender-Sensitive Statistics
Gender inequality has been, and still is, one of the most debated issues in contemporary society. Promoting gender equality and empowering women in the socio-economic arena are therefore, core policy priorities in most countries around the world. In this regard, gender-sensitive statistics are a crucial means to provide insightful information to government policy-makers and practitioners. Gender-sensitive statistics ensures data collection on specific issues that influence one gender more than the other, influence women exclusively, or closely connect to gender relations between women and men. They also help to examine progress made so far and propose possible strategies to realize gender equality and the empowerment of women and girls.
Therefore, gender-sensitive statistics is required to capture all aspects of the living experiences of women and men by reflecting on gender issues.[1] However, UNESCAP Statistic Division states that national development policies are frequently not as effective as they could be if they were increasingly specific about issues on target interventions, due to insufficient statistical data and a lack of disaggregation of data to support the policy-making process in the first place.[2] It is, therefore, important to raise awareness of the importance of disaggregating data by indicators.
As the outcome of statistical analysis can vary depending on the selection of indicators, effective monitoring and analyzing gender differences and gaps will require disaggregation of all data by sub-indicators as well as main indicators. For this reason, there is a possibility of encountering disparate outcomes measured by different factors that influence gender inequality. Data in gender statistics hence, needs to be analyzed on the basis of specific purposes and issues that are under consideration of government policy-makers and practitioners.
Gender Inequality Index (GII) and its Indicators
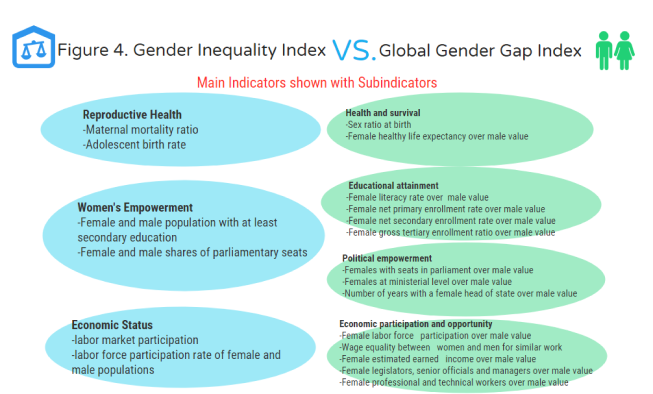
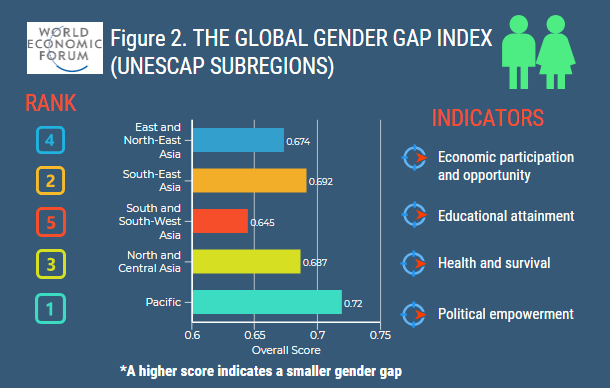
To take an example, this is evident in the case of comparing two statistical methods in relation to gender inequality and gender gap by United Nations Development Programme (UNDP) and the World Economic Forum respectively. To begin with, the Gender Inequality Index (GII) measures gender inequalities in three important aspects of human development—reproductive health, measured by maternal mortality ratio and adolescent birth rates; empowerment, measured by proportion of parliamentary seats occupied by females and proportion of adult females and males aged 25 years and older with at least some secondary education; and economic status, expressed as labour market participation and measured by labour force participation rate of female and male populations aged 15 years and older. The GII is built to better expose differences in the distribution of achievements between women and men.[3] And Figure 1. presents the GII results of the five UNESCAP subregions.[4]
Global Gender Gap Index (GGGI) and its Indicators
Next, the Global Gender Gap Index was first introduced by the World Economic Forum in 2006 as a framework for understanding the degree of gender-based disparities and tracing their progress over time. 2017’s edition of the Global Gender Gap report includes 144 countries on their progress towards gender parity on a scale from 0 (imparity) to 1 (parity) across four thematic dimensions—economic participation and opportunity, educational attainment, health and survival, and political empowerment— and provides country rankings for effective and helpful comparisons across different regions. The rankings are designed to increase international awareness of the challenges posed by gender gaps and the opportunities created by reducing them.[5] The statistical data of Figure 2. was extracted to display the average gender gap score of the UNESCAP five subregions.
The Importance of Indicators in Analyzing Different Outcomes of GII and GGGI
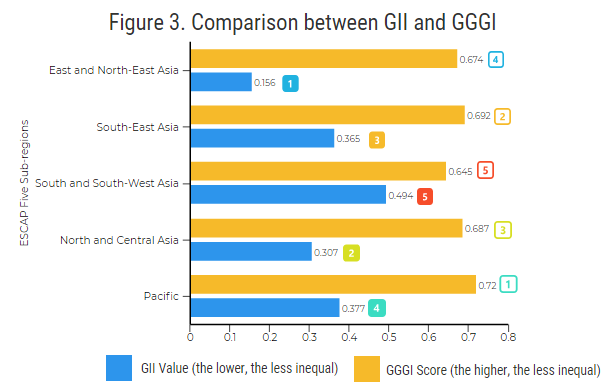
According to the two above-presented statistics, disparate outcomes from them are observed as the results of each statistics indicate a difference level of gender inequality in each region (see Figure 3.). For instance, East and North-East Asia is positioned as the fourth equal region among five regions in the Global Gender Gap Index while it is graded as the most equal region in GII. Such a seemingly contradictory outcome needs to be analyzed in depth as it can possibly bring about confusion and inaccuracy during policy-making process. Even if the main indicators of two statistical indices appear to be analogous to one another, the sub indicators that have been utilized in order to measure the main indicators appear to be more important as they can be the causes of the difference.

Intersectional Discrimination Masked by Simplistic Indicators
Furthermore, some indicators mask the reality of intersectional discrimination that many women and girls experience. Intersectional discrimination is the discrimination that young girls, elderly, disabled and migrant women face because of their particularly vulnerable circumstance engendered by their intersecting identities. However, there still remains a lack of knowledge and awareness in regard to intersectional discrimination and therefore, existing indicators remain less comprehensive without including intersectional discrimination as a crucial component in gender inequality. For example, a measurement to evaluate insufficient social protection benefits that women with disabilities have compared to women without disabilities and men with and without disabilities needs to be devised. More accurate and systematically collected statistical data distinguishing between men and women, including those with other challenges such as disability is necessary.
Until we have such information, scientific research into the situation of women with multiple challenges will be impossible and there is a risk that the representation of differences may be based simply on impressions or the bold transposition of existing data about women in general.[7] Therefore, it is important for policy-makers to examine all levels of statistical indicators in detail. Only with robust monitoring and indicator frameworks can national development policies accelerate achievement of the Sustainable Development Goals (SDGs), and particularly SDG 5 on gender equality
EPIC as a Solution Tool for Policy-Makers
ESCAP’s Gender Policy-Data Integration Initiative aims to address these complex, intertwined issues by supporting countries in applying a policy-data integration tool called EPIC (Every Policy Is Connected).[8] The major issues regarding policy monitoring between statistics and policy are lack of clear and effective understanding of statistics and thereby, misinterpreting and misrepresenting the results of statistical data.
For this reason, identifying tailored indicators that allow policy-makers to effectively monitor policy and plan development priorities is crucial for national planning and resourcing mechanisms. Moreover, in the longer term and if practiced regularly, utilizing EPIC will increase ownership of indicators and statistics among policy makers and enhance political and financial support to development of national statistical systems.[9] In this regard, ESCAP continues to advocate the mutual reinforcement of policy responsive gender-sensitive data and effective data-driven development policies on gender equality and women’s empowerment.
This blog was contributed by Ahneseu Seo, an intern with ESCAP’s Social Development Division. Views expressed are those of the author(s) and should not necessarily be considered as reflecting the views or carrying the endorsement of the United Nations.
References
- [1]UNESCAP., 2015. “Strengthening gender statistics and indicators in Asia and the Pacific: a key foundation for the sustainable development agenda beyond 2015”, [Online] Available at: https://www.unescap.org/sites/default/files/Stats_Brief_Aug2015_Issue_11_0.pdf.
- [1]UNESCAP., 2015. “Strengthening gender statistics and indicators in Asia and the Pacific: a key foundation for the sustainable development agenda beyond 2015”, [Online] Available at: https://www.unescap.org/sites/default/files/Stats_Brief_Aug2015_Issue_11_0.pdf.
- [2] Serrao, S., 2018. “Progressing Women’s Economic Empowerment: Enhancing User-Producer Engagement for Policy Responsive Data and Effective Data-Driven Policies”, 5 September, UNESCAP, [Online] Available at: https://www.unescap.org/blog/progressing-women-economic-empowerment.
- [3] UNDP., 2015. “Human Development Reports_Table 5: Gender Inequality Index”, [Online] Available at: http://hdr.undp.org/en/composite/GII.
- [4] UNESCAP., n.d. “ESCAP Statistical Online Database_Compare Countries”, [Online] Available at: http://data.unescap.org/escap_stat/#compareData.
- [5] World Economic Forum., 2017. “The Global Gender Gap Report 2017”, [Online] Available at: http://www3.weforum.org/docs/WEF_GGGR_2017.pdf.
- [6] Serrao, S.
- [7] Beleza, M. L., 2003. Discrimination against Women with Disabilities, Germany: Council of Europe.
- [8] UNESCAP., 2018. “EPIC: A Policy-Data integration tool”, [Online] Available at: https://www.unescap.org/sites/default/files/EPIC_V1.2_AB15Aug18.pdf.
- [9] Serrao, S.